Published on December 09, 2024

Table of Contents
Overview
In this article, we are going to explore the idea of Chaos Engineering and one tool, named Chaos Mesh, that can help you simulate some common types of Kubernetes cluster disruptions so that you can test how your applications respond to those events and then use that knowledge to improve the resilience of those applications against similar planned or unplanned events that may happen in the future.
NOTE: All of the custom files used in this post can be downloaded from the accompanying
gitrepository at github.com/superorbital/chaos-mesh-playground.
Chaos Engineering
Like the weather, the internet and distributed systems are unreliable. In general, they do what we expect them to do, but then they always seem to decide to do something unexpected when it is the least convenient. In the case of the weather, we prepare for this guaranteed eventuality by buying a coat and umbrella, learning how to use them properly, keeping them in good shape, and having them close at hand when we head out for the day. With distributed systems, we need to ensure that we have built, installed, tested, and practiced procedures that will ensure that our systems handle unplanned failures in the system with grace and aplomb.
Chaos Engineering is the art of intentionally injecting various forms of chaos, or failure scenarios, into a system, observing what happens, and then documenting, evaluating, and improving the system to better handle those events in the future. Although this type of testing has existed for a very long time in one form or another, the term Chaos Engineering is primarily attributed to engineers at Netflix, who, in 2011, released a tool called Chaos Monkey, which randomly terminated virtual machine (VM1) instances and containers that ran inside of their production environment, in an effort to directly expose developers to their application’s failure cases and incentivize them to build resilient services, as they were undertaking a massive migration into Amazon Web Services (AWS2). Chaos Monkey was so successful that it eventually spawned a whole series of tools that became known as the Netflix Simian Army.
Game Days
Another idea that has been around for a long time but was actively popularized in the technology field by AWS is a Game Day. To directly quote the AWS well-architected manual, “A game day simulates a failure or event to test systems, processes, and team responses. The purpose is to actually perform the actions the team would perform as if an exceptional event happened. These should be conducted regularly so that your team builds ‘muscle memory’ on how to respond. Your game days should cover the areas of operations, security, reliability, performance, and cost.”
If you want to be prepared for a human health emergency, you might take a class to learn CPR3, but unless you practice it on a regular basis, it is very likely that you will have forgotten how to do it properly when a real emergency arrives. You will either freeze or potentially even cause more damage by performing the procedure incorrectly.
Organizations and teams that really want to be prepared to handle emergencies as smoothly and effectively as possible, must practice frequently. And effective practice requires a tight feedback loop, that ideally, at a minimum, includes most of the following step plan, test, observe, document, fix, test, and repeat.
Practice Makes…Better
No process is ever perfect, but practice and follow-through can help move you in the right direction.
To get started, most organizations will want to have at least two environments: development and production. A development, integration, or staging environment often gives an organization enough redundancy to feel safe starting to experiment with chaos engineering and game days.
In these environments, it is recommended that you pick a scenario, plan it out, and then schedule a time to trigger the incident, allowing teams to observe and respond to what occurs. Some things will be expected, while others will be a complete surprise. This exercise gives teams a chance to discover many things, like previously unknown risks, unexpected edge cases, poor documentation, poor training, software bugs, issues in the incident management process, and much more.
This is a good start, but follow-up is critical! The teams that were involved must be given the space to do a thorough retrospective regarding the event, where they can discuss and document what happened and how it might be avoided or improved. When the retrospective ends, each team should have a list of action items that will be immediately converted into tickets for follow-up, design, and implementation.
As teams get more experienced with this exercise, the game days can evolve to mirror real life more accurately. Eventually, organizers can plan the event but leave the teams involved in the dark about what situation is going to be triggered. This will remove the ability for the teams to come in with anything other than their existing preparation, precisely as they would during an actual incident; no extra, specialized preparation for the event can be leaned on in this case.
This not only allows you to test the product and the teams that maintain it, but it also allows you to test the incident management process thoroughly.
- How are communications handled?
- Did the right teams get notified at the right time?
- Were we able to quickly engage the right on-call people?
- Was anyone confused or uninformed about the status of the incident at any point?
- Did we properly simulate communication with customers, leadership, etc?
Organizations and teams will improve as they practice and follow up with their findings, which is critical.
Kubernetes
So, how can this sort of testing be done within a Kubernetes cluster? There are many potential approaches, but one tool that can help mimic some of the potential failure cases that can occur within Kubernetes is Chaos Mesh, which we will discuss throughout the rest of the article.
Chaos Mesh
Chaos Mesh is an incubating open-source project in the Cloud Native Computing Foundation (CNCF4) ecosystem. The project’s source code can be found on GitHub at chaos-mesh/chaos-mesh, and it utilizes the CNCF Slack workspace for community discussions.
This tool primarily consists of four in-cluster components, described below, and one optional CLI5 tool called chaosctl.
-
chaos-controller-managerDeployment - The core component for orchestrating chaos experiments. -
chaos-daemonDaemonSet - The component on each node that injects and manages chaos targeting that system and its pods. -
chaos-dashboardDeployment - The GUI6 for managing, designing, and monitoring chaos experiments. -
chaos-dns-serverDeployment - A special DNS7 service that is used to simulate DNS faults. -
chaosctlCLI - An optional tool to assist in debugging Chaos Mesh.
Installation
To install Chaos Mesh, you will need a Kubernetes cluster. In this article, we are going to utilize kind along with Docker to manage a local Kubernetes cluster, so if you want to follow along exactly, you will need these two tools installed. However, with a bit of adjustment to the commands, most of this should work in any Kubernetes cluster.
After taking a look at the install script to ensure that it is safe to run, you can instruct it to spin up a cluster with a single worker node via kind v0.24.0 and then install Chaos Mesh v2.6.3 into the cluster using the following command.
NOTE: Some of these examples assume that there is only a single worker node in the cluster. If you are using a different setup, you may need to tweak the YAML manifest and commands to ensure you are targeting the correct pods/nodes and than observing the correct output.
$ curl -sSL https://mirrors.chaos-mesh.org/v2.6.3/install.sh | \
    bash -s -- --local kind --kind-version v0.24.0 --node-num 1 \
    --k8s-version v1.31.0 --name chaos

Install kubectl client
kubectl Version 1.31.0 has been installed
Install Kind tool
Kind Version 0.24.0 has been installed
Install local Kubernetes chaos
No kind clusters found.
Clean data dir: ~/kind/chaos/data
start to create kubernetes cluster chaosCreating cluster "chaos" ...
DEBUG: docker/images.go:58] Image: kindest/node:v1.31.0 present locally
 ✓ Ensuring node image (kindest/node:v1.31.0) 🖼
 ✓ Preparing nodes 📦 📦
 ✓ Writing configuration 📜
 ✓ Starting control-plane 🕹️
 ✓ Installing CNI 🔌
 ✓ Installing StorageClass 💾
 ✓ Joining worker nodes 🚜
Set kubectl context to "kind-chaos"
You can now use your cluster with:

kubectl cluster-info --context kind-chaos

Thanks for using kind! 😊
Install Chaos Mesh chaos-mesh
crd.apiextensions.k8s.io/awschaos.chaos-mesh.org created
…
Waiting for pod running
chaos-controller-manager-7fb5d7b648-… 0/1 ContainerCreating 0 10s
chaos-controller-manager-7fb5d7b648-… 0/1 ContainerCreating 0 10s
chaos-controller-manager-7fb5d7b648-… 0/1 ContainerCreating 0 10s
Waiting for pod running
Chaos Mesh chaos-mesh is installed successfully
Note: Chaos Mesh can easily be installed into any cluster that your
kubectlcurrent context points at by simply runningcurl -sSL https://mirrors.chaos-mesh.org/v2.6.3/install.sh | bash.
If you utilized the installer that leverages kind, then you should be able to find the cluster config and related data volumes storage in ${HOME}/kind/chaos.
If you are curious, you can investigate the main components that were installed by running kubectl get all -n chaos-mesh.
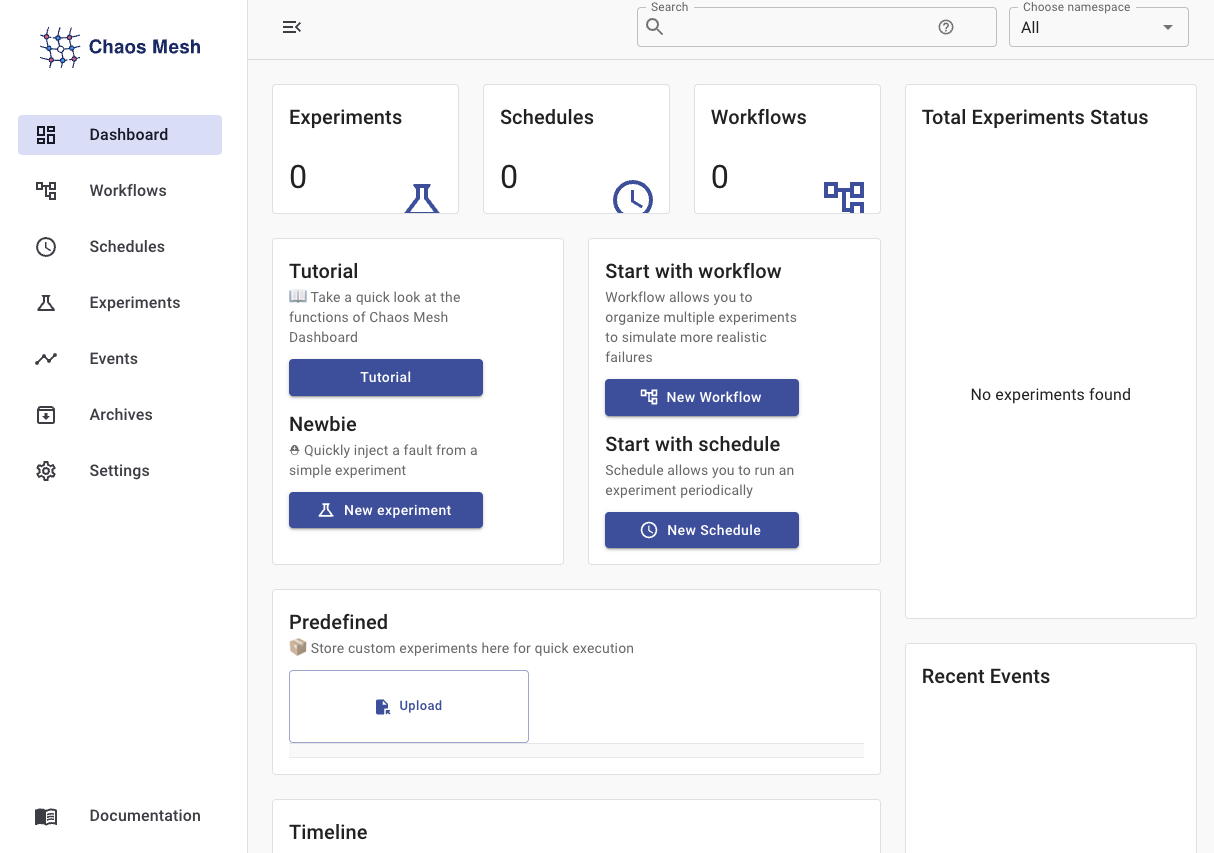
Once Chaos Mesh is installed, you can verify that you have access to the GUI by opening up another terminal window and running:
$ kubectl port-forward -n chaos-mesh svc/chaos-dashboard 2333:2333

Forwarding from 127.0.0.1:2333 -> 2333
Forwarding from [::1]:2333 -> 2333
Then, open up a web browser and point it to http://127.0.0.1:2333/#/dashboard.
If all is well, then you should see this:
Because we will want to be able to easily examine resource utilization in the course of this article, we are also going to install Google’s cadvisor to provide some simple resource monitoring, utilizing this Kubernetes YAML8 manifest, which will create the cadvisor Namespace, ServiceAccount, and DaemonSet. We can achieve this by copying the manifest below into a file called cadvisor.yaml and then running kubectl apply -f ./cadvisor.yaml.
cadvisor Kubernetes YAML Manifest
apiVersion: v1
kind: Namespace
metadata:
  labels:
    app: cadvisor
  name: cadvisor
---
apiVersion: v1
kind: ServiceAccount
metadata:
  labels:
    app: cadvisor
  name: cadvisor
  namespace: cadvisor
---
apiVersion: apps/v1
kind: DaemonSet
metadata:
  annotations:
    seccomp.security.alpha.kubernetes.io/pod: docker/default
  labels:
    app: cadvisor
  name: cadvisor
  namespace: cadvisor
spec:
  selector:
    matchLabels:
      app: cadvisor
      name: cadvisor
  template:
    metadata:
      labels:
        app: cadvisor
        name: cadvisor
    spec:
      automountServiceAccountToken: false
      containers:
      - image: gcr.io/cadvisor/cadvisor:v0.49.1
        name: cadvisor
        ports:
        - containerPort: 8080
          name: http
          protocol: TCP
        resources:
          limits:
            cpu: 4000m
            memory: 4000Mi
          requests:
            cpu: 1000m
            memory: 100Mi
        volumeMounts:
        - mountPath: /rootfs
          name: rootfs
          readOnly: true
        - mountPath: /var/run
          name: var-run
          readOnly: true
        - mountPath: /sys
          name: sys
          readOnly: true
        - mountPath: /var/lib/docker
          name: docker
          readOnly: true
        - mountPath: /dev/disk
          name: disk
          readOnly: true
      serviceAccountName: cadvisor
      terminationGracePeriodSeconds: 30
      volumes:
      - hostPath:
          path: /
        name: rootfs
      - hostPath:
          path: /var/run
        name: var-run
      - hostPath:
          path: /sys
        name: sys
      - hostPath:
          path: /var/lib/docker
        name: docker
      - hostPath:
          path: /dev/disk
        name: disk
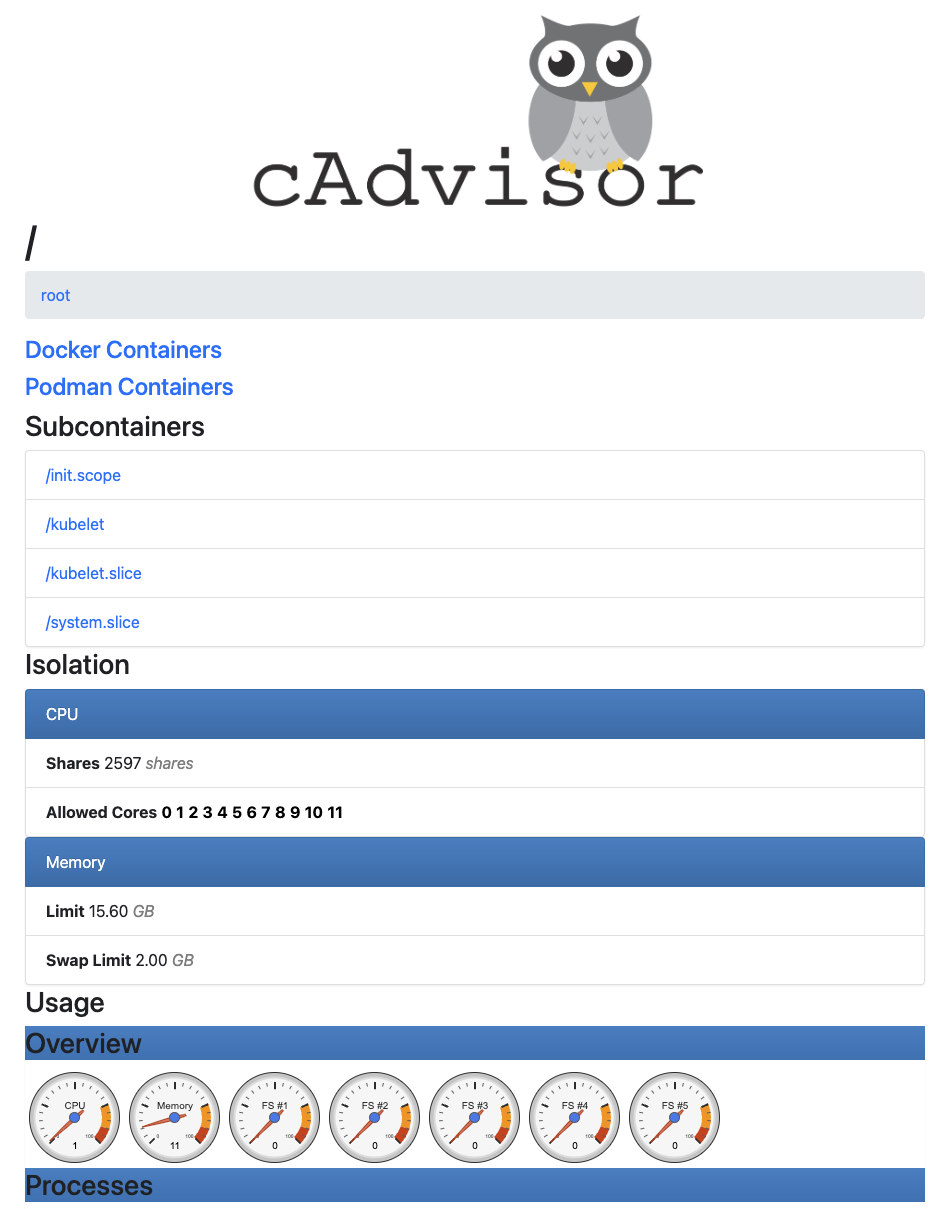
You can verify that the cadvisor DaemonSet is in a good state by running kubectl get daemonset -n cadvisor, and ensuring that there is one pod per worker, which is both READY and AVAILABLE. Once everything is running, you can access the cadvisor dashboard on one of the nodes by opening up a new terminal and running:
$ kubectl port-forward -n cadvisor pods/$(kubectl get pods -o jsonpath="{.items[0].metadata.name}" -n cadvisor) 8080

Forwarding from 127.0.0.1:8080 -> 8080
Forwarding from [::1]:8080 -> 8080
Then, open up a web browser and point it to http://127.0.0.1:8080/containers/.
If everything has gone to plan up to this point, you should see something like this:
Chaos Experiments
Chaos Mesh has three primary concepts that form the core of the tool and its capabilities. These include:
- Experiments (local UI) - which are used to define the parameters of a single chaos test that the user wants to run. This will include the type of chaos to inject into the system and specifically how that chaos will be shaped and what it will target.
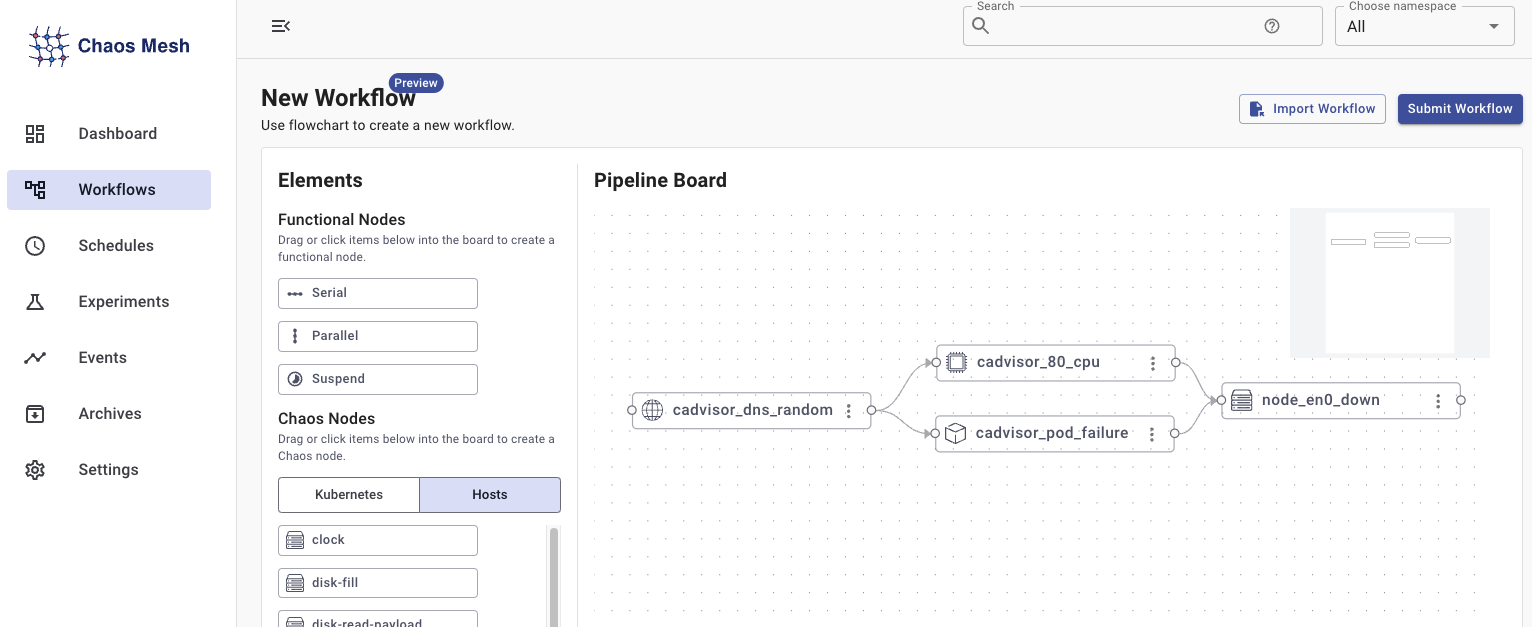
- Workflows (local UI) - this allows you to define a complex series of tests that should run in an environment to more closely simulate complex real-world outages.
- Schedules (local UI) - expands upon Experiments by making them run on a defined schedule.
In this article, we will primarily use Kubernetes manifests to demonstrate the functionality of Chaos Mesh, but many things can be done in the UI9, and the workflows UI can be particularly helpful in building complex visual workflows.
Resource Stress
So, at this point, let’s go ahead and run a simple experiment by applying some CPU10 stress to our cadvisor pod.
We’ll start by getting a snapshot of the node’s resource utilization. Since the node is actually a container in Docker, we can check it like this:
$ docker stats chaos-worker --no-stream

CONTAINER ID   NAME           CPU %     MEM USAGE / LIMIT    MEM %     NET I/O          BLOCK I/O     PIDS
4a3385d7c565   chaos-worker   7.30%     581.4MiB / 15.6GiB   3.64%     369MB / 19.5GB   0B / 1.49GB   294
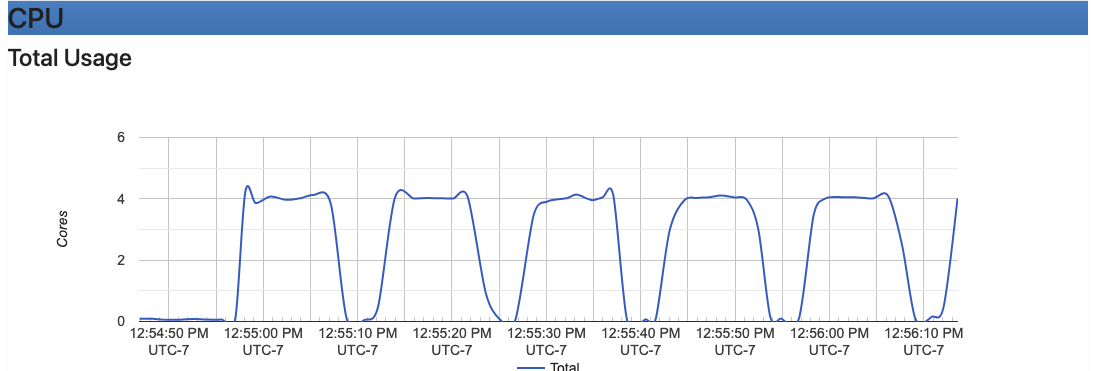
Next, let’s create and apply the following StressChaos Schedule, which will create a significant CPU load within the cadvisor pod for 90 seconds every 15 seconds, with the command kubectl apply -f ./resource-stress.yaml.
apiVersion: chaos-mesh.org/v1alpha1
kind: Schedule
metadata:
  name: resource-stress-example
spec:
  schedule: '@every 15s'
  type: StressChaos
  historyLimit: 5
  concurrencyPolicy: Forbid
  stressChaos:
    mode: all
    duration: 10s
    selector:
      namespaces:
        - cadvisor
      labelSelectors:
        'app': 'cadvisor'
    stressors:
      cpu:
        load: 100
        workers: 20
If you then wait just over 15 seconds and take another snapshot of the resource utilization, you should see something like this:
$ sleep 15 && docker stats chaos-worker --no-stream

CONTAINER ID   NAME           CPU %     MEM USAGE / LIMIT    MEM %     NET I/O          BLOCK I/O     PIDS
4a3385d7c565   chaos-worker   400.03%   617.6MiB / 15.6GiB   3.87%     371MB / 19.6GB   0B / 1.49GB   317
The cadvisor UI should also be giving you a very clear indication of this fluctuating CPU load.
It is worth noting that you can pause a scheduled experiment by annotating the Schedule like so
kubectl annotate schedules.chaos-mesh.org resource-stress-example experiment.chaos-mesh.org/pause=trueand then you can unpause it by runningkubectl annotate schedules.chaos-mesh.org resource-stress-example experiment.chaos-mesh.org/pause-. If you check cadvisor while the experiment is paused, you will see that everything has dropped back down to a mostly steady baseline value.
Now, let’s remove this schedule by running kubectl delete -f ./resource-stress.yaml so it doesn’t continue to utilize our precious CPU resources.
Pod Stability
For the next set of tests, let’s deploy three replicas of a small web application to our cluster by creating and applying the following manifest with kubectl apply -f ./web-show.yaml.
NOTE: As written, this web app will attempt to continuously ping the Google DNS server(s) at 8.8.8.8; if you are unable to ping this IP address, you can replace the IP address in this manifest with something else in your network that will respond to a ping.
apiVersion: v1
kind: Service
metadata:
  name: web-show
  labels:
    app: web-show
spec:
  selector:
    app: web-show
  ports:
    - protocol: TCP
      port: 8081
      targetPort: 8081
---
apiVersion: apps/v1
kind: Deployment
metadata:
  name: web-show
  labels:
    app: web-show
spec:
  replicas: 3
  selector:
    matchLabels:
      app: web-show
  template:
    metadata:
      labels:
        app: web-show
    spec:
      containers:
        - name: web-show
          image: ghcr.io/chaos-mesh/web-show
          imagePullPolicy: Always
          command:
            - /usr/local/bin/web-show
            - --target-ip=8.8.8.8
          env:
            - name: TARGET_IP
              valueFrom:
                fieldRef:
                  fieldPath: status.podIP
          ports:
            - name: web-port
              containerPort: 8081
          resources:
            requests:
              memory: "10Mi"
              cpu: "100m"
            limits:
              memory: "512Mi"
              cpu: "1000m"
Once applied, let’s open another terminal and monitor the pods that we just deployed.
$ kubectl get pods --watch

NAME                        READY   STATUS    RESTARTS   AGE
web-show-76b9dd8f44-5ks6j   1/1     Running   0          36s
web-show-76b9dd8f44-g9hrj   1/1     Running   0          35s
web-show-76b9dd8f44-mxx6z   1/1     Running   0          38s
In the original terminal, we can now apply the following Chaos Schedule, which will cause a web-show pod to fail every 10 seconds.
apiVersion: chaos-mesh.org/v1alpha1
kind: Schedule
metadata:
  name: web-show-pod-failure
spec:
  schedule: '@every 10s'
  type: PodChaos
  historyLimit: 5
  concurrencyPolicy: Forbid
  podChaos:
    action: pod-failure
    mode: one
    selector:
      namespaces:
      - default
      labelSelectors:
        app: web-show
After you create and apply this with kubectl apply -f ./pod-failure.yaml, you can observe what happens to the pods you are watching on the other terminal. The output should look something like the one shown below.
NAME                      READY  STATUS            RESTARTS    AGE
web-show-76b9dd8f44-5ks6j 1/1   Running           0           36s
web-show-76b9dd8f44-g9hrj 1/1   Running           0           35s
web-show-76b9dd8f44-mxx6z 1/1   Running           0           38s
web-show-76b9dd8f44-mxx6z 1/1   Running           0           5m36s
web-show-76b9dd8f44-mxx6z 0/1   RunContainerError 1 (0s ago)  5m37s
web-show-76b9dd8f44-mxx6z 0/1   RunContainerError 2 (0s ago)  5m38s
web-show-76b9dd8f44-mxx6z 0/1   CrashLoopBackOff  2 (1s ago)  5m39s
web-show-76b9dd8f44-mxx6z 0/1   RunContainerError 3 (1s ago)  5m52s
web-show-76b9dd8f44-mxx6z 0/1   RunContainerError 3 (15s ago) 6m6s
web-show-76b9dd8f44-mxx6z 0/1   CrashLoopBackOff  3 (15s ago) 6m6s
web-show-76b9dd8f44-g9hrj 1/1   Running           0           6m3s
web-show-76b9dd8f44-mxx6z 1/1   Running           4 (15s ago) 6m6s
web-show-76b9dd8f44-g9hrj 0/1   RunContainerError 1 (1s ago)  6m4s
web-show-76b9dd8f44-g9hrj 0/1   RunContainerError 2 (0s ago)  6m5s
web-show-76b9dd8f44-g9hrj 0/1   CrashLoopBackOff  2 (1s ago)  6m6s
web-show-76b9dd8f44-g9hrj 0/1   RunContainerError 3 (1s ago)  6m22s
web-show-76b9dd8f44-g9hrj 0/1   RunContainerError 3 (12s ago) 6m33s
web-show-76b9dd8f44-g9hrj 0/1   CrashLoopBackOff  3 (12s ago) 6m33s
web-show-76b9dd8f44-mxx6z 1/1   Running           4 (45s ago) 6m36s
web-show-76b9dd8f44-g9hrj 1/1   Running           4 (12s ago) 6m33s
Most types of Chaos have a few modes or actions that can be taken. Let’s remove this experiment using kubectl delete -f ./pod-failure.yaml.
Then, we can add a very similar experiment that will kill a pod instead of causing it to fail by applying the following YAML with kubectl apply -f ./pod-kill.yaml.
apiVersion: chaos-mesh.org/v1alpha1
kind: Schedule
metadata:
  name: web-show-pod-kill
spec:
  schedule: '@every 10s'
  type: PodChaos
  historyLimit: 5
  concurrencyPolicy: Forbid
  podChaos:
    action: pod-kill
    mode: one
    duration: 30s
    selector:
      namespaces:
      - default
      labelSelectors:
        app: web-show
Once the experiment has been applied, the output from kubectl get pods --watch should now display something like this:
NAME                      READY STATUS            RESTARTS AGE
web-show-76b9dd8f44-5clbk 1/1   Running           0        4s
web-show-76b9dd8f44-hzwn8 1/1   Running           0        5m18s
web-show-76b9dd8f44-rfxrw 1/1   Running           0        34s
web-show-76b9dd8f44-hzwn8 1/1   Terminating       0        5m24s
web-show-76b9dd8f44-hzwn8 1/1   Terminating       0        5m24s
web-show-76b9dd8f44-zcwbq 0/1   Pending           0        0s
web-show-76b9dd8f44-zcwbq 0/1   Pending           0        0s
web-show-76b9dd8f44-zcwbq 0/1   ContainerCreating 0        0s
web-show-76b9dd8f44-zcwbq 1/1   Running           0        1s
web-show-76b9dd8f44-zcwbq 1/1   Terminating       0        10s
web-show-76b9dd8f44-zcwbq 1/1   Terminating       0        10s
web-show-76b9dd8f44-xvnh2 0/1   Pending           0        0s
web-show-76b9dd8f44-xvnh2 0/1   Pending           0        0s
web-show-76b9dd8f44-xvnh2 0/1   ContainerCreating 0        0s
web-show-76b9dd8f44-xvnh2 1/1   Running           0        1s
If you compare the earlier pod behavior with this, you will notice that in the original Pod failure experiment, we see messages like RunContainerError and CrashLoopBackOff, while in this Pod kill experiment, we see messages like Terminating, Pending, and ContainerCreating. This is because the first experiment replicates an application crash, while the second experiment simply uses a normal Unix signal to kill the container.
We can regain our pod stability by removing the scheduled experiment from the cluster with kubectl delete -f ./pod-kill.yaml.
Network Latency
Next, we will generate network latency for a set of our pods by defining a scheduled NetworkChaos experiment. But first, let’s examine the web UI that the web-show application generates.
In another terminal window, run the following command to forward a host port to the web-show service.
$ kubectl port-forward service/web-show 8081

Forwarding from 127.0.0.1:8081 -> 8081
Forwarding from [::1]:8081 -> 8081
Now, you should be able to point your web browser at http://127.0.0.1:8081/ and see web-show’s simple latency chart. This chart is currently configured to show the latency between our pods and the Google DNS servers at 8.8.8.8 (or whatever IP address you used in the web-show manifest).
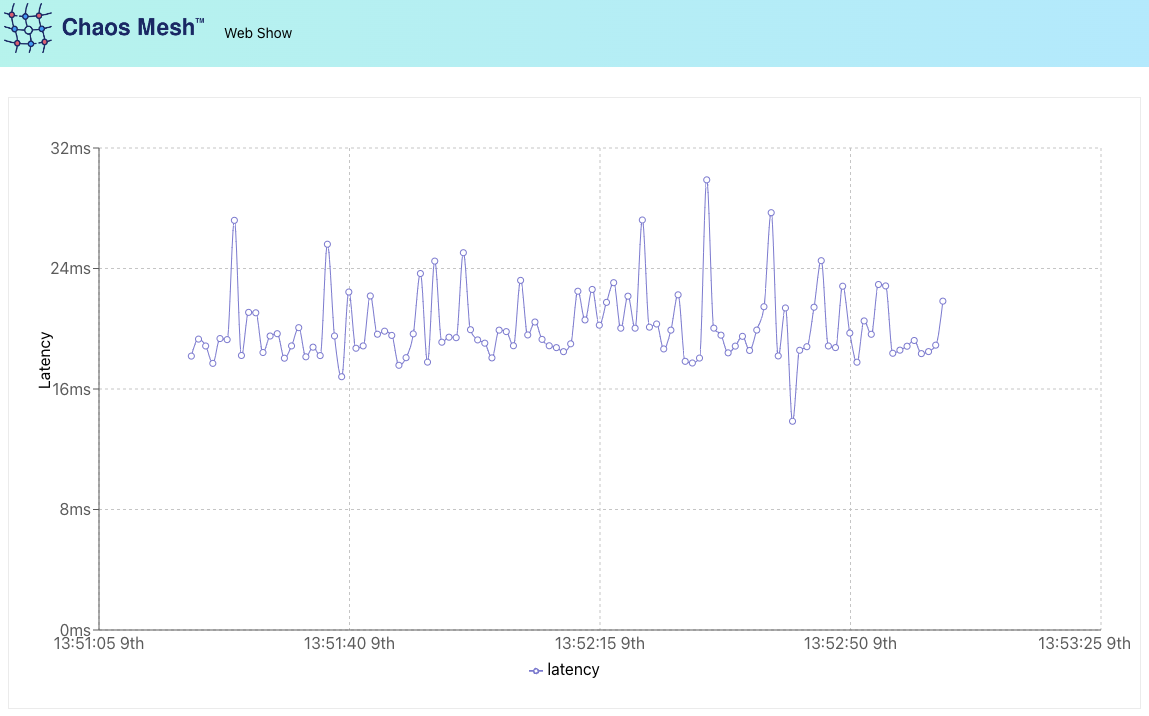
Let’s leave the web-show UI running and then apply the following YAML file to the cluster, using kubectl apply -f ./network-delay.yaml.
apiVersion: chaos-mesh.org/v1alpha1
kind: Schedule
metadata:
  name: web-show-network-delay
spec:
  concurrencyPolicy: Forbid
  historyLimit: 5
  networkChaos:
    action: netem
    mode: all
    selector:
      namespaces:
        - default
      labelSelectors:
        'app': 'web-show'
    delay:
      latency: '500ms'
      correlation: '100'
      jitter: '100ms'
    duration: 10s
  schedule: '@every 20s'
  type: NetworkChaos
This YAML is using the network emulation action to introduce 500 milliseconds of delay with a 100-millisecond jitter (fluctuation) to the web-show pods’ network packets.
After it has run for a minute or two, the chart should look something like this:
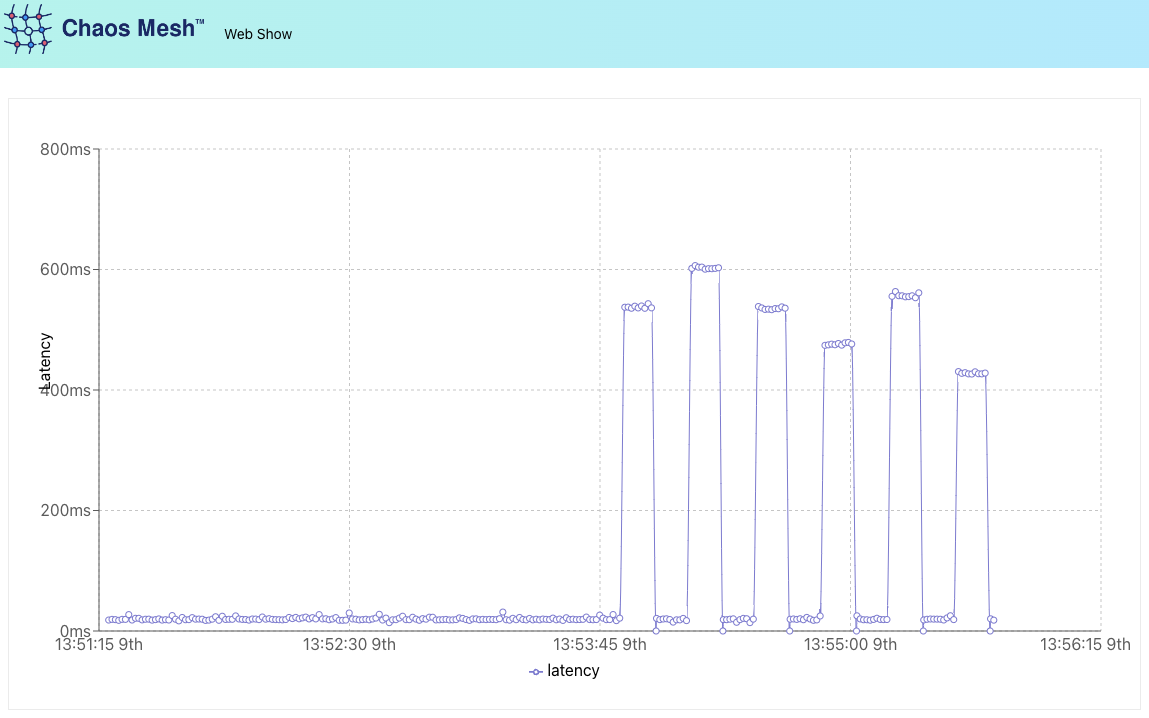
As usual, to remove the experiment, we can simply run kubectl delete -f ./network-delay.yaml and then run kubectl delete -f ./web-show.yaml to remove the web-show Deployment and Service.
Clean Up
At this point, you can go ahead and stop any kubectl port-forward … or kubectl … --watch commands that you still have running by switching to that terminal and pressing [Control-C]. Then you can use kubectl delete … to remove anything else that might still be lingering around.
If you are using a temporary cluster, you can de-provision it to ensure that everything is cleaned up. If you are using the kind cluster created by the installation script, then this should be as easy as running kind delete cluster --name chaos.
Detailed instructions on uninstalling Chaos Mesh from a cluster can be found in the documentation.
Conclusion
Chaos-Mesh is an interesting tool for exploring some common failure modes that can impact applications running inside Kubernetes environments. It can complement other testing tools in the ecosystem, like testkube.
There are several open-source, cloud-native, and commercial tools that specialize in robust tooling for Kubernetes-focused chaos engineering, but for those who are just getting started with Chaos Engineering, Chaos Mesh provides a simple and approachable open-source tool that can help adopters understand some of the more significant resiliency risks in their stack and point them in the right direction to documenting those issues and prioritizing fixes.
So, what are you waiting for? There is no better time than right now to start practicing and improving your platform’s resiliency. You can take it slow, but creating a healthy habit takes practice and repetition.
Further Exploration
- Chaos Mesh
- LitmusChaos
- AWS Fault Injection Simulator
- Azure Chaos Studio
- Gremlin
- Conf42 Chaos Engineering 2025
- Chaos Engineering: System Resiliency in Practice
Acknowledgments
- Cover image by darksouls1 from Pixabay
