
Published on May 04, 2022
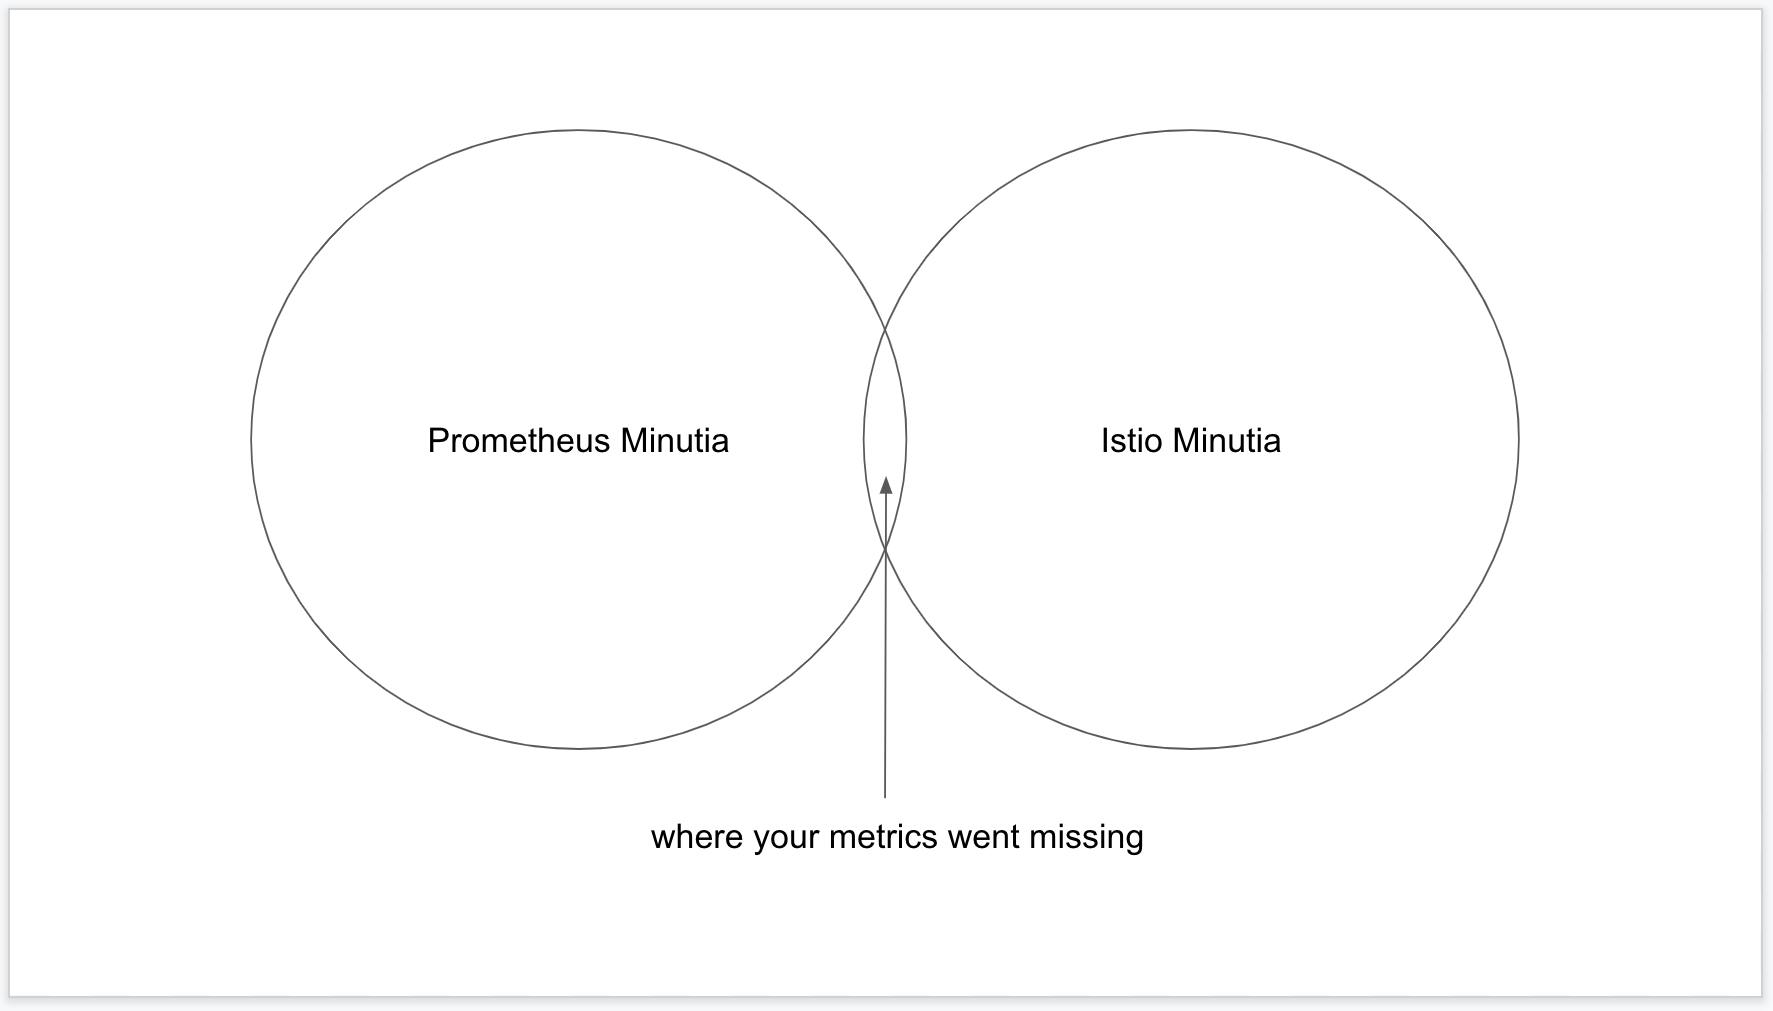
This is a story about two large software projects which are widely deployed on Kubernetes, and two features which would work together seamlessly in a perfect world but in practice often lead to confusion and frustration. The integrated features we are going to examine are Kubernetes service discovery in Prometheus and metrics merging in Istio.
Istio metrics merging is one of those tucked away little features which, if it works for you, you will never even know it’s there. But if it doesn’t you may never discover it exists or how much it could have saved your ass. It may seem counterintuitive that you wouldn’t notice a malfunctioning feature, but there’s a small cloud of out-of-date info and incomplete solutions floating around out there obscuring the issue and I want to clear the air with this post.
Prometheus’ pull-based approach to metrics collection means that in a world where containers, pods, instances, or whole availability zones could vanish, restart, drop, or otherwise shuffle about at any time, a static configuration file telling Prometheus where to connect to fetch its metrics from is not robust enough for the modern production environment.
Prometheus supplemented the original static scrape job definition the project launched with by adding their first support for dynamic service discovery using Consul in mid 2015 with the release of Prometheus 0.14.0. Support for other service discovery backends quickly followed with Kubernetes arriving in 0.16.0 a few months later in this PR.
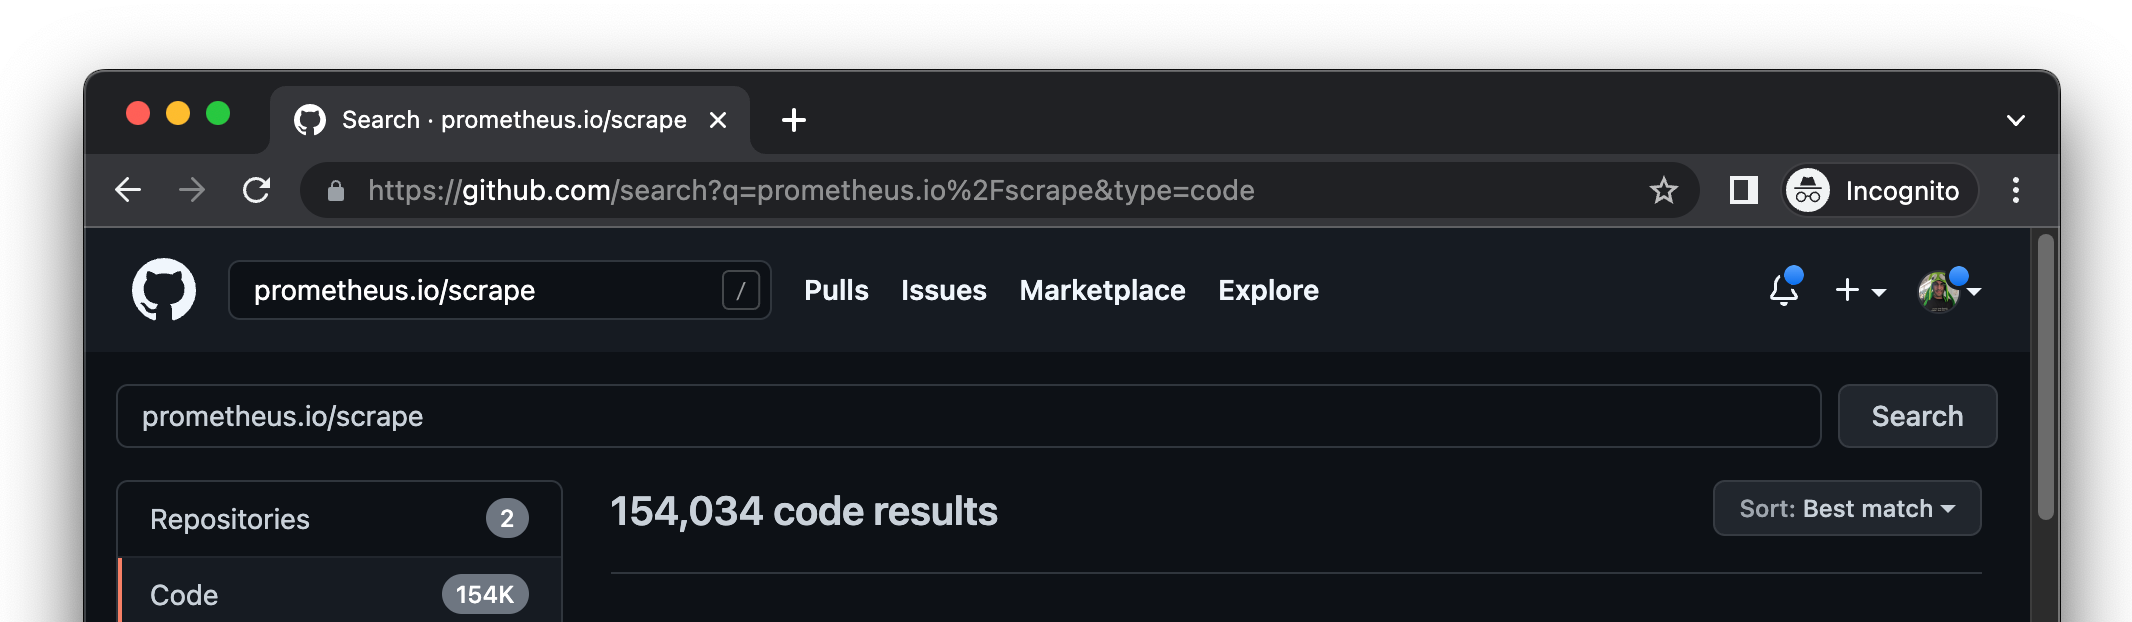
That initial Kubernetes service discovery implementation introduced what has now become a broadly adopted convention; checking for the presence of the Kubernetes annotation prometheus.io/scrape: true as a means of discovering where Prometheus should look for metrics.
A couple years later in early 2018 Istio 0.5.0 dropped, featuring this change that provided a huge increase in visibility. In this release Istio added support for Prometheus and Grafana as optional add-ons and the project also adopted the use of the prometheus.io/scrape annotation for automatically letting Prometheus know where to find all those metrics that service mesh fans are so excited about. That turned out to be poor timing because just five months later the Prometheus project abandoned the scrape annotation with the release of Prometheus 2.3.0.
The problem the Prometheus team had found was that users had been adopting the prometheus.io/scrape annotation pattern from the project’s example config file (the pattern has since been removed) without taking the time to understand the limitations.
To be fair, I did the same thing. You may have done it too.
Primary among these limitations is the fact that you cannot use the annotations to make Prometheus fetch metrics from multiple ports in a single pod, so if you have multiple containers exposing metrics in a pod (foreshadowing: Istio is built on sidecars) you’ll be missing data.
Just one month after the scrape annotation pattern was removed from the example config in the main Prometheus github project, a user of the Prometheus operator suggested adding it to the default configuration of that project. Since the operator is largely maintained by the same folks who maintain Prometheus, the teams were at least able to present a unified stance on the matter. They stuck to their position that the scrape annotation example, while helpful for getting started, is not considered best practice and offered workarounds.
That’s the story of how Prometheus accidentally created a de facto standard that grew to be wildly popular and is no longer recommended.
So what does that have to do with Istio? And why do so many projects still use it if it’s not recommended? We’ll talk about Istio first, then the rest of ‘em.
Istio sticks a proxy between your app and everything it talks to, providing an external means of controlling the way your app communicates without requiring code changes. Your app talks to foo.com but foo.com is flaky? The Istio proxy will retry failed requests for you. Something talks to your app and sometimes your app responds slowly? The Istio proxy will provide visibility into those latencies. Your app needs to ensure all calls to your internal services are encrypted, authenticated, and authorized? Istio will handle that via mutual TLS (mTLS), and so on.
If you need some standard thing you could implement by writing a little network code, Istio can probably do it for you.
But if your app happens to expose a Prometheus formatted /metrics endpoint, the Istio proxy is going to get in between that and Prometheus too. This is where the trouble starts.
Istio also handles load balancing between pods in your cluster, offering more control than the default Kubernetes ClusterIP load balancing model provides. This is great for stateless apps that don’t care which pod their request lands on, but it falls flat on its face for something like Prometheus whose whole reason for being is to scrape every pod in your workload individually and aggregate the metrics it finds there. If you put an Istio proxy on Prometheus, it can’t target individual pods to do its job, so most people don’t do it.
Or at least, they didn’t until something changed.
Remember that mutual TLS thing that Istio does? Out of the box it sends in-mesh traffic mTLS encrypted, accepts anything that comes in mTLS encrypted, but also accepts cleartext. So when Prometheus (with no proxy to handle encryption for it) comes knocking to collect metrics, everything is copacetic.
But if Istio users configure mTLS in “strict” mode, the proxies will stop accepting cleartext requests and Prometheus can’t scrape metrics anymore. It’s speaking HTTP and the pods are only accepting HTTPS. Grafana dashboards go blank. Chaos ensues. The shattered husks of broken SRE’s stare numbly at the horizon with haunted eyes …
What were we talking about?
In May of 2018, just one month before the Prometheus project stopped recommending the use of the scrape annotation, an Istio user asked for help with making Prometheus play nice with Istio and mTLS. Back then the Istio mTLS implementation stored it’s root certificate in a Kubernetes secret called istio.default, so a couple months later a PR was merged which configured Prometheus to mount that secret as a Kubernetes volume and use it when scraping metrics from workloads protected by mTLS. To be clear, this approach allowed Prometheus to pass through the mTLS boundary the Istio proxy was enforcing. That feature became available in Istio 1.0.3 in October of 2018 narrowly missing the change in recommendation from the Prometheus project.
That worked fine until the release of Istio 1.5 which arrived in early 2020. Prior to that release it was quite rightly recognized that sticking the root cert for the whole service mesh into a Kubernetes secret where anyone could find it and use it to decrypt traffic and/or impersonate any identity in the mesh was not ideal. In a push to improve the security posture of the project Istio moved to no longer create the istio.default secret, instead Istio proxies would obtain the certificates they need for mTLS by leveraging SDS, the underlying Envoy project’s Secret Discovery Service.
Great, now our secrets aren’t laying around for anyone to come along and find them. But what about Prometheus? How would it pass through the mTLS barrier? To address that problem two plans here hatched, a quick fix, and a proper long term solution.
The quick fix (also included in Istio 1.5) was “simple”. Stick an Istio proxy on the Prometheus pod but turn all the service mesh bits off so that it would not interfere by doing all its fancy load balancing stuff. Then use the Secret Discovery Service certificate fetching mechanism to download the certs and inject them into the Prometheus pod via a volume mount. This would still let Prometheus pass through the mTLS barrier unblocking people while the team worked on what is now known as Istio metrics merging.
Note: while you can still find people suggesting the use of an Istio sidecar being added to Prometheus to enable mTLS scraping, that approach is no longer recommended or necessary, do not do this! (read on for a full solution).
Here’s a quick overview of how metrics merging works. Without Istio in the mix, metrics scaping is pretty straightforward.
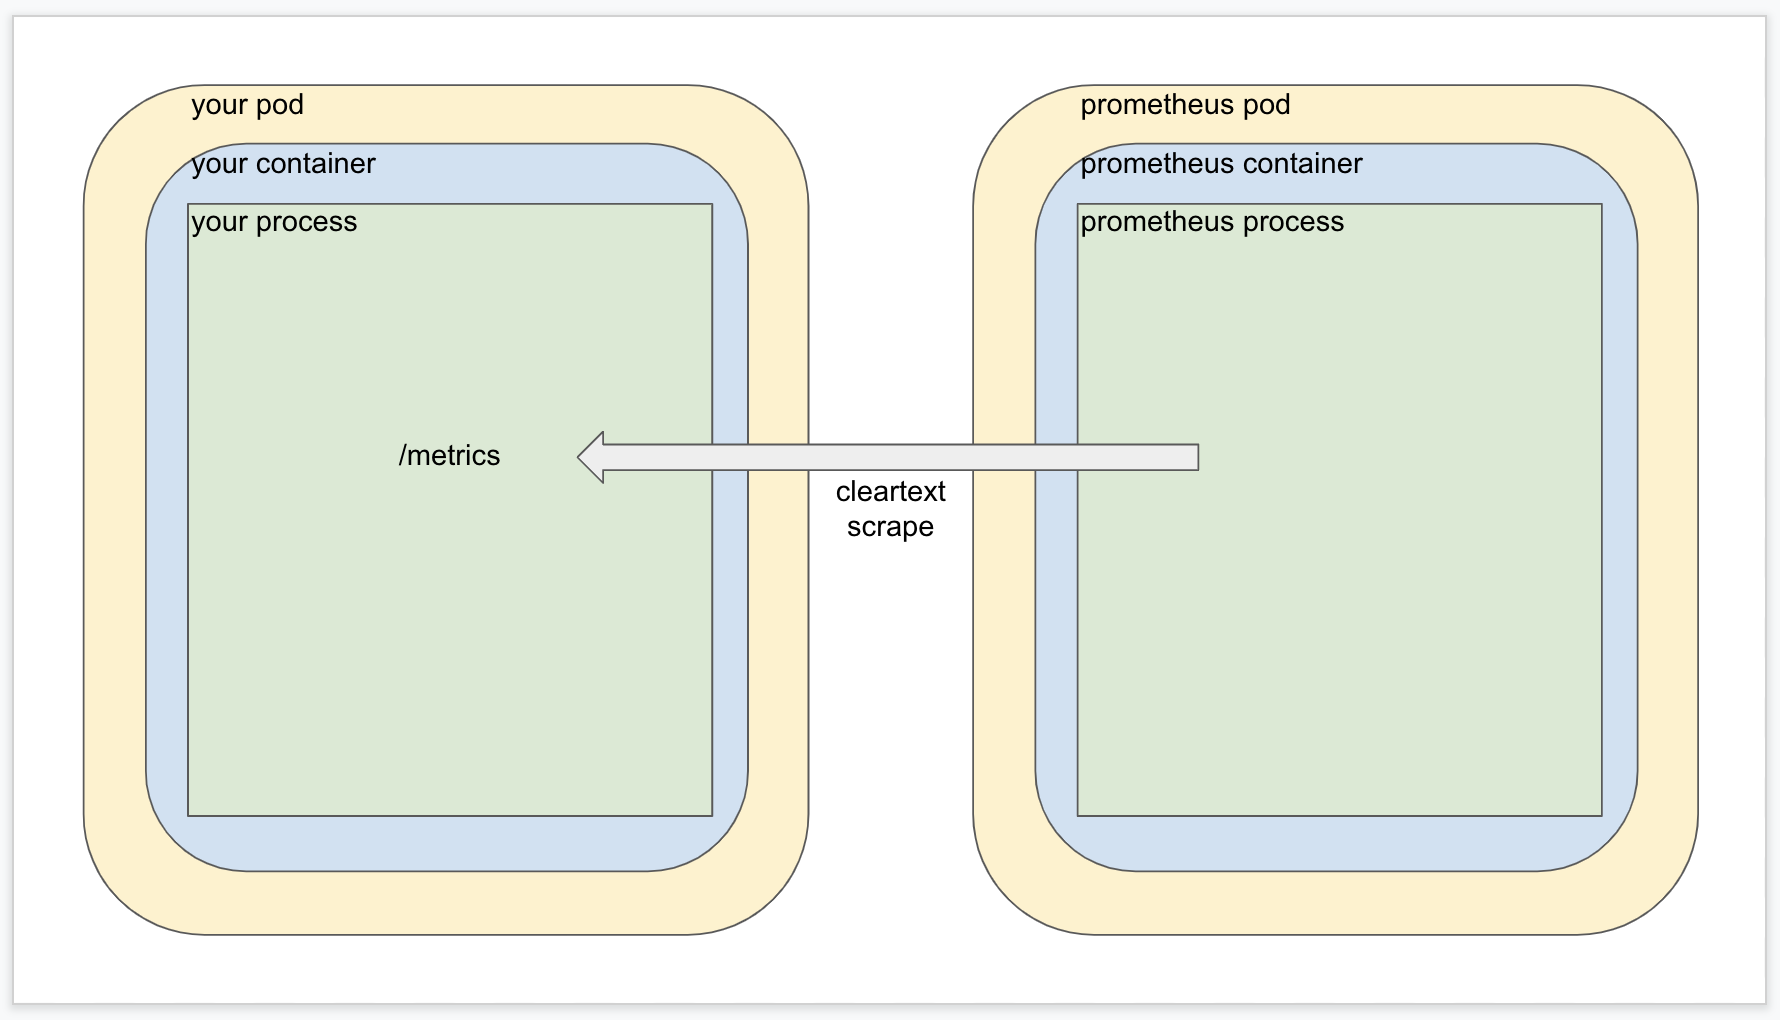
When you add the Istio proxy and leave the default “permissive” mode where mTLS is optional, it’s a little more involved but not much. The request goes through the sidecar proxy, gets redirected to the application, and hits the desired endpoint.
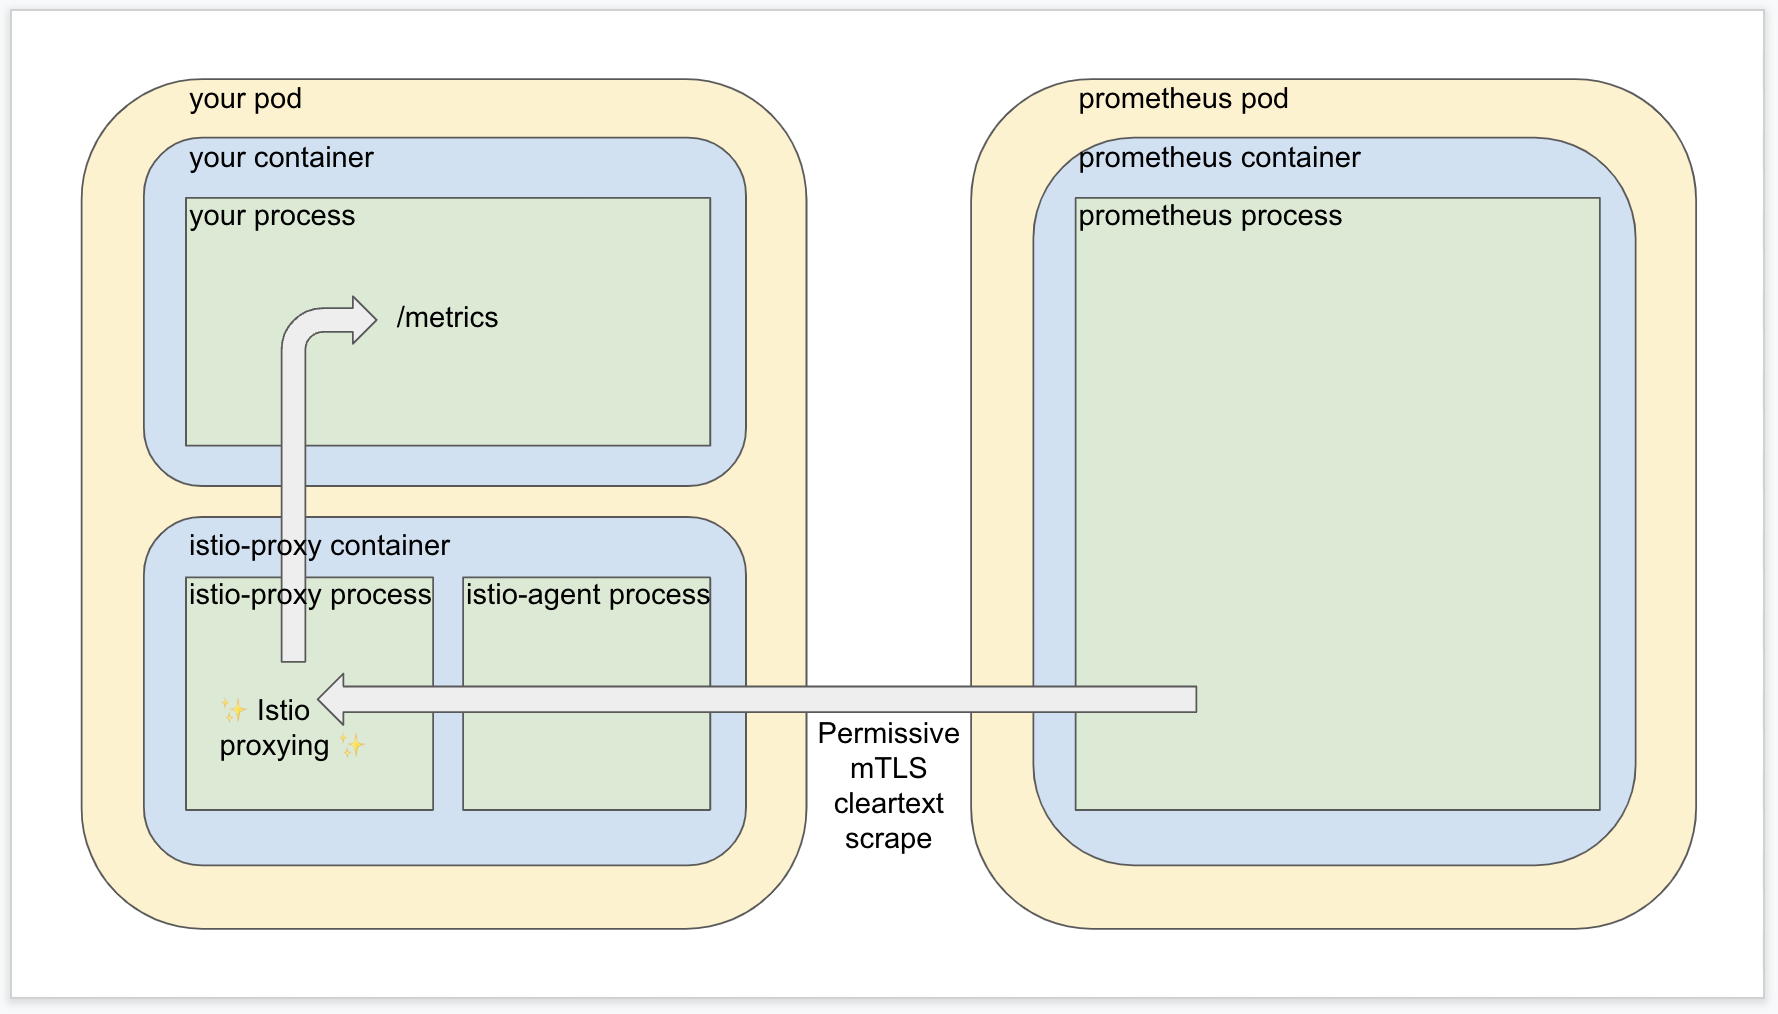
We know that configuring Prometheus for scraping via mTLS complicates the right hand side of the diagram, so metrics merging doesn’t go down that path. Moreover, one of the whole reasons to have a service mesh in the first place is that the Istio proxy container provides a whole pile of metrics of its own that are extremely valuable! But we know that the whole problem with the scrape annotations is that they’re not able to accommodate multiple metrics targets in a single pod, so now what?
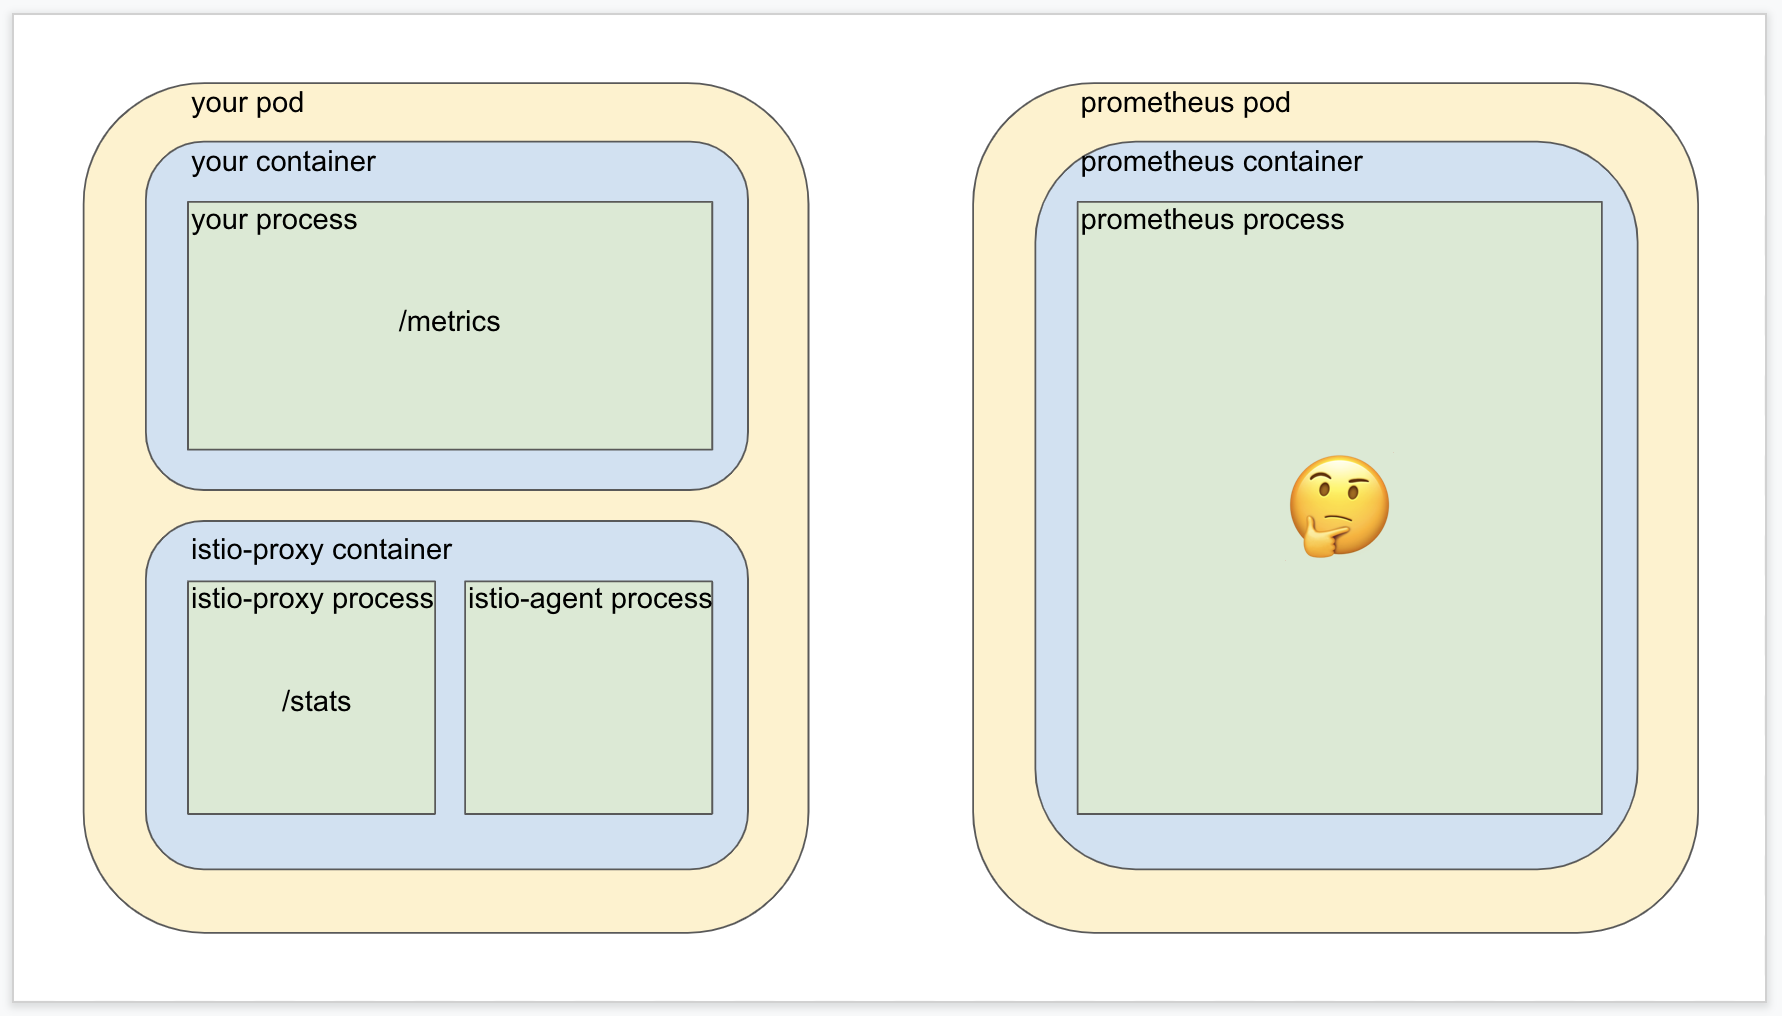
Well the design of Istio metrics merging solves this problem by using Istio’s privileged position inside the target pod to act as an intermediary layer. A subcomponent of the sidecar container called the Istio agent is configured to scrape both the Istio proxy metrics AND your application’s metrics, and then roll them together into one place for Prometheus to scrape in one shot without the need for mTLS. (The Istio agent process manages the mesh but does not participate in it).
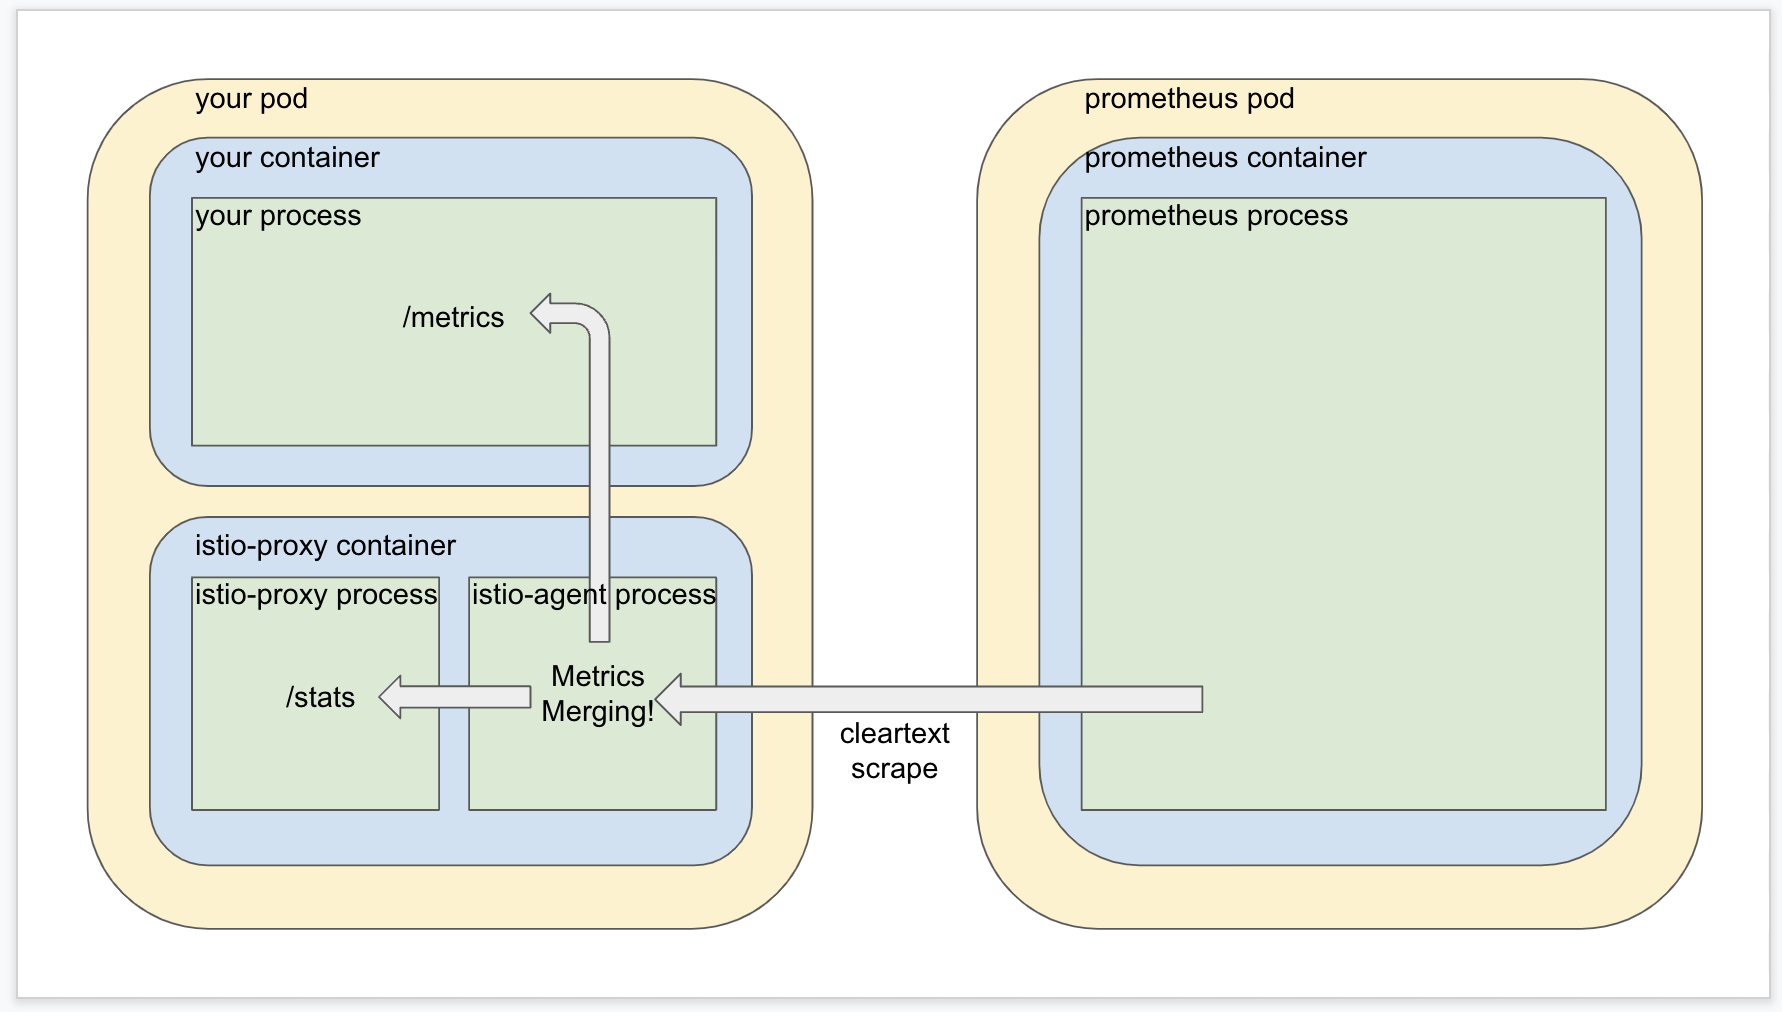
Now how do you think the Istio agent process in the sidecar container knows where to look to find your application metrics? If you guessed that it honors the prometheus.io/scrape annotation, take a few extra cookies for yourself out of petty cash because that’s exactly what it does.
Note: if this seems like a crazy idea, then Istio is in good company because Hashicorp added a very similar feature to Consul connect (which succumbs to the same integration difficulties with Prometheus).
When your application pod is created an Istio mutating webhook is invoked which takes care of adding the sidecar container to your pod. If metrics merging is enabled, then the webhook will also take note of the prometheus.io/scrape annotations you are using and pass them as input into the Istio agent process so it knows where to find the metrics it will merge with the Istio proxy metrics.
But if you don’t have the scrape annotation on your pod spec, how would the Istio agent ever know where to look for metrics to be merged? And why would you ever use the scrape annotations when the Prometheus maintainers don’t recommend them? Maybe you got lucky and discovered the example Prometheus configuration provided by Istio, but why would you ever use that when the Istio maintainers clearly state that it’s “not suitable for large-scale meshes”?
This is the core of the confusion. The Istio project doesn’t want to tell you how to configure your Prometheus installation, and the Prometheus project can’t in good conscience endorse using the scrape annotations Istio’s observability features rely on. These projects solve wildly different problems and need to rely on their users to handle integration in the way that best suit their own needs.
Now let’s talk about making it work.
If your application metrics “just worked” out of the box with Prometheus and Istio mTLS in strict mode, then I bet you installed Prometheus by way of the extremely popular Prometheus Community helm chart. The folks behind the Prometheus Community Github org decided to disregard the recommendations of the Prometheus and Prometheus operator maintainers and ship their configuration with support for the scrape annotations enabled by default.
Near as I can tell the next most popular ways of deploying Prometheus into Kubernetes are the Bitnami helm chart, the official Prometheus Operator static manifests, or the Prometheus Community kube-operator-stack helm chart. At the time of this writing, none of these ship with support for scrape annotations enabled.
So if you started from one of those, or any one of the many other ways you could deploy Prometheus into your Kubernetes cluster that does not include the discouraged approach of using Prometheus scrape annotations to aid service discovery, then the day Istio mTLS strict mode was enabled in your cluster was a sad day indeed.
So what should you do in that case?
Well if you’re not using the operator I think the easy way out is to just add support for the scrape annotations to your Prometheus config, add the annotations to your workloads, and make sure Istio metrics merging is enabled (it’s on by default since Istio 1.7.0).
But that’s easy for me to say, I’m not on call for your infrastructure am I? Keep the limitations in mind. If you’re running multi-container pods you’ll need to spend more time thinking about your scrape configuration, perhaps adding other Prometheus scrape jobs specifically to target those extra containers. If you’re using the Prometheus Operator, you can configure scrape jobs via the provided PodMonitor CRD which is more expressive than the scrape annotation convention. The Istio maintainers have an example PodMonitor object that will help get you started. Note that this example configuration will only scrape pods that have the prometheus.io/scrape label, IF there is also a container called istio-proxy in the pod, which should reduce the chances of this causing problems with other multi-container pods.