
Published on April 27, 2022
Table of Contents
Introduction
Developing applications for distributed systems can be extremely challenging. Errors can be introduced in many parts of the network stack across multiple machines in different availability zones or regions. Kubernetes often serves to amplify some of these challenges, but can also provide us with good tooling for collecting needed information across multiple machines. This is the story of one such error.
The application here is a straightforward use case of pulling a large set of data from Amazon S3 using Apache Arrow. This client is developing a large Python data processing application against S3, using the library PyArrow and its FileSystem interface. This allows standard file operations to be run directly against parquet data in a bucket. This library has a high upfront cost when initializing the filesystem, as it makes a number of upfront requests that grow as the number of objects in the bucket increase.
The development team started reporting some odd error messages coming from PyArrow, that boiled down to the simple message AWS error: [Code 12]. This error was introduced as we rolled out Cilium Layer 7 Protocol policies to that environment, so we had to diagnose why these new policies could create an issue, and what this mysterious Code 12 meant.
Debugging in Kubernetes Environments
When working in a Kubernetes environment, it can often be difficult to track down where a request failure is being introduced. This is why gathering data across the entire system, using frameworks like OpenTelemetry, has gained such traction as Kubernetes usage has grown. In this situation, we had to first figure out the path of the request that was failing.

In this case, the cilium-agent compiles eBPF programs into the Linux kernel to route matching network packets from the host to the Envoy proxy for Layer 7 evaluation. Cilium provides a custom build of Envoy, which compiles in a set of Envoy filters built by the Cilium project. This is a standard pattern for applications that build on top of Envoy, Istio does the same thing with its fork of Envoy.
With continued testing, it is clear that this error only occurs when the Layer 7 filtering is enabled, so we have to find where the error is occurring within this path. Let’s start with the source and destination. Looking at the PyArrow documentation and Github issues didn’t yield much. The error Code 12 was being output from the AWS library in use, but we couldn’t find additional context within this source. Requests are failing, but not in the Arrow internals.
Now, looking at the destination, we started by confirming that these requests were not reaching S3 by enabling S3 server access logging. There were a few intermittent 503 responses, but there were fewer 503 errors on the server side as errors we could create client side. With this access logging on, we could see a large number of successful requests at first, but the stream of requests stopped before the error was printed on the client side.
The layer 7 filtering appears to be causing these issues, so let’s see what we can do with Envoy to get more information!
Digging Into Cilium Envoy
First, we had to figure out how this thing worked! We knew the Layer 7 protocol visibility was implemented by Envoy, but had no idea how Envoy was running in our cluster. There wasn’t an Envoy pod started somewhere in the Cilium namespace, so it must be hidden inside our existing deployments. It turns out that the cilium-agent daemonset starts the Envoy proxy as a subprocess within the agent pod and uses its privileged position in the host network namespace to capture traffic .
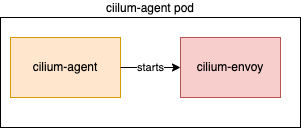
All the Envoy configuration is passed directly from the cilium-agent process to Envoy over unix sockets set up on the host. This means that we can update the cilium-agent Daemonset configuration to get additional data from Envoy.
Metrics!
The first configuration parameter we tried was setting up Envoy to export Prometheus metrics. This was immediately helpful to identifying what was occurring here. We found the host that the application pod was running on and queried these metrics. Let’s take a look at a couple important ones.
envoy_cluster_upstream_rq{envoy_response_code="503",envoy_cluster_name="egress-cluster-tls"} 98
envoy_cluster_upstream_cx_connect_fail{envoy_cluster_name="egress-cluster-tls"} 392
Notice the numbers here, there are 98 503 errors. There are 392 cx_connect_fail errors. These numbers are related by a factor of 4! What could be running 4 times to cause these upstream failures. Let’s look at the envoy config dump:
"route": {
    "cluster": "egress-cluster-tls",
    "timeout": "1s",
    "retry_policy": {
        "retry_on": "5xx",
        "num_retries": 3,
        "per_try_timeout": "0s"
    },
    ...
There we go! 3 retries, 1 original request. There is a factor of four between the connection failures and the upstream request 503 errors. We first wanted to rule out a connectivity issue with a timeout, so we again turned to the cilium-agent configuration, this time raising the connection timeout to 30s from its default 1s. We were hoping to find a bottleneck on connection creation while the large number of requests were made, instead the errors occurred before we hit this new timeout. We had to continue to dig deeper.
The Role of S3
After looking at these metrics, we figured we had to try to find out why these connection failures were occurring. We could get even more data from the Envoy process by turning on debug logging. Staring at these logs in depth, we found something really interesting. Our application could send exactly 100 requests successfully, then we would start to receive these 503 errors. We could force kill the Envoy process on the host and once again send 100 requests without errors, but the errors would always start again.
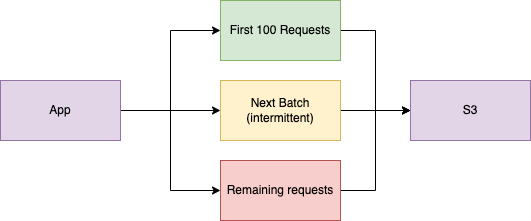
This is a perfectly round number, so we looked into the limitations of S3. This led us to some discussion around how S3 handles connection re-use.The S3 API will accept 100 requests on a single TCP connection and then sends back a Connection: Close header. After this response, it will reject all future requests on that existing connection. It didn’t appear that Cilium Envoy was handling this header correctly, or at least consistently. In order to avoid this situation, we sent a patch upstream to the cilium agent to alter the Envoy configuration by limiting the number of requests sent on a single connection, using the CommonHttpOptions settings. We built this new agent image and resumed testing.
Something very strange happened here that we were only able to identify because of what we did initially in gathering metrics. We still received errors, but less often. This was a challenging situation because one of our datasets that, before the patch, would consistently fail was now, after applying this patch, succeeding regularly. We had to draw on a different use case to regularly reproduce these failures. PyArrow has its own retry mechanism, so it was sometimes able to overcome the now smaller set of errors by doing its own retries.
A Problem of Reuse
You know the old phrase, “reduce, reuse, recycle.” Reuse can be especially beneficial in computer science to avoid having to remake completed calculations, especially when those are in a latency sensitive path, such as the middle of an HTTP connection. In this case, an attempt at reuse got caught up within a broader request/response path and created a bit of an ugly race condition! Let’s see how this went down.
Once again, we are in an odd spot. Our application is still failing when enough data is requested, which is especially frustrating for users as the behavior appears entirely arbitrary. We enabled the Envoy trace log in the cilium agent and began to investigate. Let’s take a look at a block of trace logs:
[2022-03-23 12:53:25.866][401][debug][pool] creating a new connection
[2022-03-23 12:53:25.866][401][trace][filter] Set socket (131) option SO_MARK to 32030b00 (magic mark: b00, id: 12803, cluster: 0), src: 10.0.43.18:37372
[2022-03-23 12:53:25.866][401][debug][client] [C119] connecting
[2022-03-23 12:53:25.866][401][debug][connection] [C119] connecting to 52.217.196.218:443
[2022-03-23 12:53:25.866][401][debug][connection] [C119] immediate connect error: 99
[2022-03-23 12:53:25.866][401][trace][connection] [C12] socket event: 2
[2022-03-23 12:53:25.866][401][trace][connection] [C12] write ready
[2022-03-23 12:53:25.866][401][trace][connection] [C119] socket event: 3
[2022-03-23 12:53:25.866][401][debug][connection] [C119] raising immediate error
[2022-03-23 12:53:25.866][401][debug][connection] [C119] closing socket: 0
[2022-03-23 12:53:25.866][401][trace][connection] [C119] raising connection event 0
[2022-03-23 12:53:25.866][401][debug][client] [C119] disconnect. resetting 0 pending requests
[2022-03-23 12:53:25.866][401][debug][pool] [C119] client disconnected, failure reason: immediate connect error: 99
[2022-03-23 12:53:25.866][401][debug][router] [C12][S11104213793689600036] upstream reset: reset reason: connection failure, transport failure reason: immediate connect error: 99
As we parsed through this log, we tried to identify some of the key components describing the error here. First, we note this error:
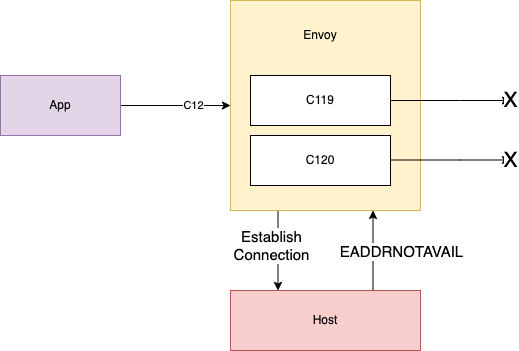
[2022-03-23 12:53:25.866][401][debug][connection] [C119] immediate connect error: 99
This error 99 corresponds to EADDRNOTAVAIL in Linux. Then, we see that the router relays the error received while attempting to connect to S3 on C119 (connection 119) back to the source pod using C12 (connection 12).
[2022-03-23 12:53:25.866][401][debug][router] [C12][S11104213793689600036] upstream reset: reset reason: connection failure, transport failure reason: immediate connect error: 99
This aligns with what we saw in our upstream connection failure metrics. The above line tells us that the proxy wrote back to the pod and told it, “sorry, no can do.” C119 is a new connection, never before seen in the log, as evidenced by the first log line from the excerpt:
[2022-03-23 12:53:25.866][401][debug][pool] creating a new connection
Now, we tried to see what was in common for C119 from other connections that may have succeeded. This is where we found our culprit! Notice the second line:
[2022-03-23 12:53:25.866][401][trace][filter] Set socket (131) option SO_MARK to 32030b00 (magic mark: b00, id: 12803, cluster: 0), src: 10.0.43.18:37372
The first key piece of information in this log line is src: 10.0.43.18:37372. This same source IP address/port was successfully used in many previous connections in this log file. We tracked down this log line in the custom Envoy filters in the cilium/proxy code.
Looking at that code, we notice the comment right above:
// Allow reuse of the original source address. This may by needed for
// retries to not fail on "address already in use" when using a specific
// source address and port.
This is odd because we are receiving a cousin of the “address already in use” errors now! Looking back at that log line above, the next key piece of information is Set socket option SO_MARK. By setting the socket option SO_REUSEADDR together with SO_MARK, you tell the kernel that even though the address is in use (code 98) please try to use it anyway. The kernel responds “no can do” as that socket isn’t just in use, it is currently reading a response from the upstream. After C119 fails here, C120 begins and gets into the same loop, which is demonstrated in the next log line in the trace:
[2022-03-23 12:53:25.866][401][debug][router] [C12][S11104213793689600036] performing retry
Envoy attempts to retry the failed connection and from this point on we are in a consistent failure state with that EADDRNOTAVAIL error continuing down the log.
Clearly, this was an issue with the socket reuse mechanism specific to the custom Cilium filters. We reached out to the team and described the issue and provided this information from the logs. After some further discussion, the team pushed a patch that eliminated this socket reuse for all identities outside of the cluster. Before this patch, all WORLD identities (destination addresses outside of the cluster not known by cilium) were excluded from socket reuse. When you apply a network policy using a destination FQDN rule, that target is no longer a WORLD identity and is provided a local identity by cilium-agent. The patch now ensures that both WORLD identities and local identities are excluded from socket reuse, eliminating the bug.
Resolution
After the cilium/proxy maintainers published a new image with this patch, we rebuilt the cilium image with this fix, updated our Kubernetes cluster with the new image, and viola! Our application is now working with no intermittent failures. We have now sent many days worth of requests through this proxy and with the data we now know how to collect, we see that this error has been eliminated!
Lessons Learned
What are the lessons we took away from this issue? One of the interesting things we found while debugging this issue is that though the HTTP response was providing us with a 503 error, there was no part of the request path that was explicitly returning a 503. Instead the proxy translated a connection failure into an HTTP 503, as it was applying a policy at layer 7. Understanding the source and possible causes of these errors took us deep into the implementation of this policy set.
This was also a problem introduced by a complexity decision we had made earlier. When deploying distributed systems, additional complexity should be taken on gradually and intentionally. We evaluated many tools for this network policy implementation and selected Cilium for its feature set across layer 4 and layer 7, as well as an active and growing community. To resolve this issue, we reached out to this broader community through Github and Slack to help diagnose, resolve, and validate this problem and its resolution.
Finally, having good metrics and logging allowed us to confirm that the problem was resolved in the long term across a disparate set of Kubernetes clusters. Before we began this exploration, we were not aware of the exact volume of requests or our current success rate. After this exploration, we continue to gather these metrics to enable us to build dashboards and create alerts to highlight if an issue of this nature ever occurs again.